Short Answer: No, at least not necessarily, and not necessarily right now or right here. Detecting a species' DNA in an air sample tells you that DNA from that species was present in the air at the time of sampling. It does not confirm that the individual was alive, that it was physically at the sampling location, or that the population is viable. The DNA may have travelled from somewhere else, persisted from a past visit, or arrived via a prey item. That said, these limitations do not make airborne eDNA useless: they make it essential to understand the difference between what a detection means and what it does not. Used correctly, airborne eDNA is a powerful and credible monitoring tool. Used naively, it can mislead.
1. The fundamental question
This is the question that determines whether airborne eDNA can be trusted as regulatory evidence. A government ecologist commissioning a site survey needs to know: if the analysis says a species is present, how confident should they be? And if it says absent, what does that actually mean?
The honest answer is more nuanced, and ultimately more useful, than a simple yes or no.
The answer varies by:
-
1Taxon grouplarge mammals shed more DNA than small invertebrates
-
2Population sizelarge populations are likely to produce a stronger DNA signal
-
3Activity levels hibernation, active shedding through movement or spore productions
-
4Distance from sourcesignals weaken with distance
-
5Environmental conditionswind, rain, temperature affect signal strength and persistence
-
6Sampling efforta single sample vs. continuous monitoring over weeks
Understanding these variables is what converts a raw detection into a scientifically defensible conclusion.
2. Why a detection might not confirm local presence
2.1 Long-range transport
Airborne particles carrying DNA can travel considerable distances.
Tournayre et al. (2025) estimated median transport distances of ~18.6 km from UK air quality monitoring stations. Under certain atmospheric conditions, particularly strong winds or storm events, DNA can travel much further. Lynggaard et al. (2024) found that weather conditions influenced which vertebrate taxa were detected, with windy periods producing detection of taxa that were likely not present in the immediate vicinity.
2.2 Temporal persistence
DNA does not instantaneously disappear from the air when an animal leaves an area.
Under certain conditions (low UV exposure, dry conditions, cool temperatures, enclosed spaces) airborne DNA can persist for hours to days after the source organism has departed. Clare et al. (2022) found DNA from zoo animals detectable inside sealed buildings even after the animals had been moved.
For most field monitoring applications, day-to-day persistence is not a major problem: a detection most likely reflects recent presence (within the past 24–48 hours). But for rare taxa in sensitive regulatory contexts, the possibility that a detection reflects a past visit rather than current residency needs to be acknowledged.
2.3 Secondary transfer via prey and diet
Airborne eDNA can arrive at a sampling location via organisms that have consumed target species
An owl that has eaten a field mouse will deposit mouse DNA through its pellets and faeces. A bat that has caught an insect will exhale and shed DNA from its prey. This secondary transfer is generally considered a minor contribution to the total signal, but it cannot be ruled out entirely, particularly for small invertebrates that appear in the diets of many larger species.
Clare et al. (2022) explicitly detected food items from air sampled in zoo enclosures, demonstrating that the food chain is reflected in the airborne DNA pool. They framed this as a feature (revealing ecological interactions), but it is simultaneously a potential complication for species presence inference.
2.4 Non natural sources of eDNA
Non-natural sources of eDNA are those that reach the sample via human activity rather than through the organism's presence.
Food products, particularly processed meat, fish, and dairy, are a primary category. A beef burger at a picnic, packaged smoked salmon in a kitchen, or dried pet food in a barn will all shed DNA into the surrounding air. The DNA detected may be genomically identical to the target wild species (or a domestic relative), making bioinformatic discrimination difficult without strict contextual controls.
Manufactured animal-derived materials are a second category: leather, wool, feathers and down, horn, and bone can all release DNA into the air when disturbed, abraded, or worked. A taxidermied specimen in a museum, a wool blanket in a study site shelter, or feathers in a bird ringer's bag represent potential sources of non-living but genetically authentic DNA.
Facility-proximate contamination is a third category: zoo enclosures, wildlife rehabilitation centres, farm buildings, and abattoirs generate very high concentrations of airborne DNA from captive animals. Samples collected near such facilities may detect species that are genuinely absent from the surrounding wild landscape.
The practical implication is that environmental context must always be documented alongside sampling. Detections of taxa that are inconsistent with the landscape type, particularly domestic species or commercially traded organisms, should trigger scrutiny of potential non-natural sources before a conclusion of wild presence is drawn.
2.5 Cross-contamination in the laboratory
Unlike the field-based issues above, contamination is largely preventable but requires rigorous protocols.
The extreme sensitivity of PCR-based methods means that trace amounts of DNA introduced during extraction, amplification or sequencing can produce false positive detections. This is not unique to airborne eDNA (it affects all eDNA methods) but the small total quantities of DNA in many air samples make contamination controls especially important (Alberdi et al. 2018; Goldberg et al. 2016).
All credible airborne eDNA studies include extraction blanks, PCR negative controls, and field blanks (filters handled in the field but not exposed to air). Any species detection that appears in a negative control must be treated as a potential false positive.
2.6 Mis-read, mis- annotation or classification
Bioinformatic and sequencing errors can produce a category of false detections.
The DNA sequence is real and was genuinely present in the sample, but the identification assigned to it by the computational pipeline is incorrect.
Chimeric sequences arise during PCR when an incomplete extension product from one template re-anneals to a different template in the next cycle, producing a hybrid sequence that does not correspond to any real organism. Chimera-detection algorithms (implemented in tools such as UCHIME, USEARCH, and DADA2) remove most chimeras during bioinformatic processing, but no algorithm eliminates them entirely. In complex mixtures with many taxa, as in airborne eDNA from diverse communities, chimera formation rates are elevated relative to simpler samples.
Tag jumping (also called index switching or tag bleed) occurs when multiple samples are multiplexed on the same sequencing run. Adapter-ligated DNA molecules can swap their identifying indices during cluster generation on Illumina flow cells, causing a read from one sample to be misassigned to another. In airborne eDNA studies, where many low-concentration samples are typically run together, tag jumping can produce phantom detections in samples that should be blank. Rodriguez-Martinez et al. (2025) confirmed that T4 DNA polymerase use during library preparation is a major contributor to the process, and that combinatorial tagging protocols are substantially more susceptible than twin-tagging approaches. Estimated contamination rates range from 0.1–10% of reads depending on library preparation method and sequencing chemistry.
Taxonomic misannotation in reference databases propagates errors from the database into identification results. Reference sequences deposited under incorrect species names, chimeric sequences submitted inadvertently, or sequences from misidentified museum voucher specimens are all present in GenBank and BOLD. A sequencing read that is genuinely from organism A may be assigned to organism B if organism B's incorrectly deposited sequence is the best database match. Tournayre et al. (2025) explicitly flagged this risk for some of their unexpected species detections.
Low-complexity sequences and multi-taxon matches represent a fourth class of error: some genomic regions are so conserved that a short barcode fragment matches equally well to many different taxa. In such cases, the pipeline may assign a taxonomic identity at the wrong confidence level, or collapse the read into an incorrect higher-level taxon. This is particularly relevant for bacterial 16S reads and some plant ITS sequences, where short fragments provide insufficient resolution.
3. Why a detection is still highly informative
The limitations above do not invalidate airborne eDNA as a monitoring tool: they define the appropriate conditions for its use. The same kind of reasoning applies to every other monitoring method:
- A camera trap detects an image of a fox, but cannot confirm the fox is still alive, currently resident, or part of a breeding population
- An acoustic recorder detects a bat call, but cannot distinguish individual animals or confirm territory occupancy
- A transect survey counts a bird, but the individual may be a passing migrant, not a breeding resident
Every ecological detection method produces probabilistic evidence, not certainty. The appropriate response is not to reject the method but to understand what strength of inference it supports.
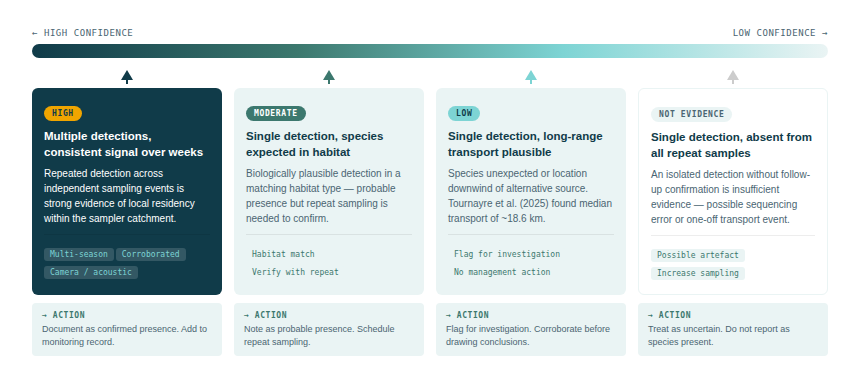
For airborne eDNA, the key principle is: a detection is strong evidence that the species was present, within the catchment area of the sampler, within a few days of sampling. If there are multiple detection the evidence is much stronger. This is a useful and credible statement, provided the catchment area is understood and the temporal window is appropriate to the management question.
3.1 Consistency across methods provides confirmation
The strongest evidence for species presence comes from multiple independent lines of evidence pointing in the same direction. Polling et al. (2024) found that airborne eDNA detected all vertebrate species identified by camera traps, and additional species besides. Warmer et al. (2025) found that acoustic monitoring and airborne eDNA had a considerable overlap in detected species and that unique detections by each method were biologically plausible rather than artefacts.
Where airborne eDNA detections are corroborated by camera trap images, acoustic recordings, or traditional survey records, confidence in the detection is substantially higher. In regulatory contexts requiring verified species presence (e.g. protected species surveys under planning law), corroborating evidence from multiple methods should be the standard.
3.2 Community-level patterns are robust even when individual detections are uncertain
Even if some individual species detections are uncertain, community-level patterns (species richness, diversity indices, temporal trends in community composition) are highly robust to occasional false positives. Sullivan et al. (2025) validated their community-level trends against independent point-transect survey data and found strong concordance (adjusted R² = 0.60 for bird abundance trends), despite the fact that any individual genus might have some uncertainty in its detection.
This is an important point for policy applications: airborne eDNA is most reliable as a system-level indicator of ecosystem health and biodiversity trends, and somewhat less reliable as a species-specific presence confirmation tool. Both uses have legitimate applications, but they require different evidence standards.
4. What a negative result means
The interpretation of a negative detection (a species expected in an area that is not found) is at least as important as understanding positives.
A negative airborne eDNA result could mean:
-
1The species is genuinely absent from the catchment area
-
2The species is present but at low density, below the detection threshold for the method
-
3The species is present but its DNA shedding rate is low under current conditions
-
4The weather conditions during sampling were unfavourable (heavy rain washes DNA from the air; calm conditions limit dispersion into the sampler catchment)
-
5The sampling duration was insufficient to capture a rare or episodic DNA signal
-
6The reference database does not contain a matching sequence for the local population
Tournayre et al. (2025) found that airborne eDNA recovered fewer taxa overall than large-scale citizen science programmes, but detected species that were harder to spot visually. This implies that the method has taxon-specific sensitivity that must be characterised before interpreting negative results.
The practical implication is clear: airborne eDNA cannot be used to certify absence of a species. It can detect presence; it cannot confirm absence with the same confidence.
5. How the field is addressing these limitations
The research community is actively working to move from presence/absence interpretation towards more quantitative and probabilistic frameworks:
6. Invasive species detections: a special case
The detection of potentially invasive species deserves specific discussion because the regulatory stakes are highest here. Early detection of an invasive species before it becomes established can enable rapid response and eradication, but a false positive can trigger costly, unnecessary interventions.
Tournayre et al. (2025) detected several invasive or non-native species in their UK national survey, including Eastern grey squirrel (confirmed invasive), weevils, mosquitoes, and tentatively Silver carp (not recorded in UK). They were explicit that such detections "should be interpreted with caution as we anticipate errors in reference collections and often encounter IDs which are challenging to interpret at the species level given the small fragments of DNA being used."
This is a good template for regulatory communication: airborne eDNA can flag potential invasive species detections that warrant follow-up investigation, but should not on its own trigger regulatory action without corroboration. The appropriate role is as a sentinel system that identifies candidate detections for verification by other methods, not as a primary evidence source for enforcement.
7. Summary: a framework for interpreting detections
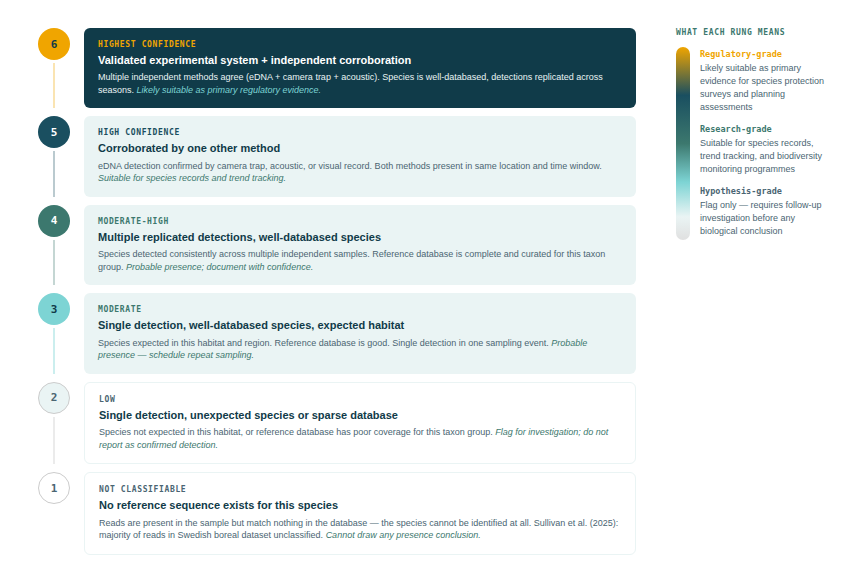
8. Caveats and open questions
No agreed regulatory framework yet exists. Unlike aquatic eDNA for great crested newt (which has a defined, legally recognised protocol in the UK), no equivalent framework has been developed for airborne eDNA in any jurisdiction. This means practitioners must exercise careful judgment about what standard of evidence is appropriate for a given regulatory context.
The signal-to-noise problem is taxon-specific and incompletely characterised. We do not yet have systematic data on the minimum population density needed to reliably detect each taxon from airborne eDNA. Large, high-biomass mammals are clearly detectable; rare invertebrates at low density may fall below the detection threshold entirely.
Temporal persistence in natural environments is poorly measured. Most persistence data come from aquatic eDNA studies (which show DNA persisting from hours to days in flowing water). Persistence of airborne DNA under field conditions has not been systematically measured.
References
- Alberdi A et al. (2018). Scrutinizing key steps for reliable metabarcoding. Methods in Ecology and Evolution 9:134–147. https://doi.org/10.1111/2041-210x.12849
- Biggs J et al. (2015). Using eDNA to develop a national citizen science monitoring programme for the great crested newt. Biological Conservation 183:19–28. https://doi.org/10.1016/j.biocon.2014.11.029
- Clare EL et al. (2022). Measuring biodiversity from DNA in the air. Current Biology 32(3):693–700. https://doi.org/10.1016/j.cub.2021.11.064
- Cristescu ME & Hebert PDN (2018). Uses and misuses of environmental DNA in biodiversity science and conservation. Annual Review of Ecology, Evolution and Systematics 49:209–230. https://doi.org/10.1146/annurev-ecolsys-110617-062558
- Ficetola GF et al. (2016). How to limit false positives in environmental DNA and metabarcoding? Molecular Ecology Resources 16(3):604–607. https://doi.org/10.1111/1755-0998.12508
- Goldberg CS et al. (2016). Critical considerations for the application of environmental DNA methods. Methods in Ecology and Evolution 7:1299–1307. https://doi.org/10.1111/2041-210X.12595
- Harrison JB et al. (2019). Predicting the fate of eDNA in the environment and implications for studying biodiversity. Proceedings of the Royal Society B 286:20191409. https://doi.org/10.1098/rspb.2019.1409
- Lynggaard C et al. (2024). Airborne environmental DNA captures terrestrial vertebrate diversity in nature. Molecular Ecology Resources 24:e13840. https://doi.org/10.1111/1755-0998.13840
- Polling M et al. (2024). Continuous daily sampling of airborne eDNA. Environmental DNA 6:e591. https://doi.org/10.1002/edn3.591
- Rodriguez-Martinez S et al. (2025). Tag jumping produces major distortion on metabarcoding-based reconstructions of past and present environments. Environmental DNA 7:e70148. https://doi.org/10.1002/edn3.70148
- Sullivan AR et al. (2025). Airborne eDNA captures three decades of ecosystem biodiversity. Nature Communications 16:11281. https://doi.org/10.1038/s41467-025-67676-7
- Tournayre O et al. (2025). First national survey of terrestrial biodiversity using airborne eDNA. Scientific Reports 15:19247. https://doi.org/10.1038/s41598-025-03650-z
- Tulloch RL et al. (2025). Winds of Change: Charting a Pathway to Ecosystem Monitoring Using Airborne Environmental DNA. Environmental DNA 7:e70134. https://doi.org/10.1002/edn3.70134
- Warmer J et al. (2025). Validating airborne eDNA using manual surveys, acoustic monitoring and camera traps. Environmental DNA. https://doi.org/10.1002/edn3.70222