Short Answer: Not reliably: not yet, and not in the way most policymakers initially assume. Detecting a species’ DNA in the air does not currently tell you how many individuals are present. Elizabeth Clare, one of the field’s pioneers, stated plainly: "The simple answer is no. You can’t know the abundance unless you have extremely controlled conditions." That said, there is genuine emerging evidence that under continuous monitoring, trends in relative DNA signal can track trends in animal abundance over time, which is a different, more useful claim than absolute counts, and one that Sullivan et al. (2025) have validated against independent survey data.
1. Why quantification matters, and why it is hard
Biodiversity monitoring for conservation and policy purposes ideally provides not just species lists but population estimates: how many individuals, is the population increasing or declining, is the density above or below a viable threshold? These are the metrics that underpin decision-making in species protection law, habitat assessment, and biodiversity credit markets.
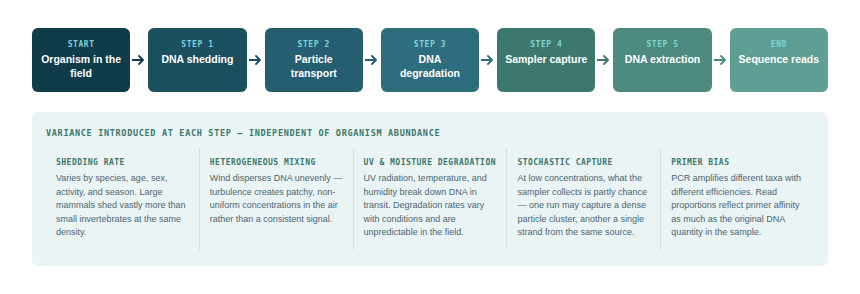
eDNA methods in general, and airborne eDNA in particular, face a fundamental challenge in providing these metrics. The number of DNA copies detected in a sample is influenced by many factors beyond organism abundance:
-
1DNA shedding ratevaries among species, individuals, life stages, and behaviours
-
2Particle transport efficiency depends on wind, particle size, distance from source
-
3DNA degradation variable with UV, temperature, humidity
-
4Chance airborne eDNA is stochastic and particle capture is likely random at low volumes
-
5Sampling efficiencydifferent sampler types capture different particle size fractions with different efficiencies
-
6DNA extraction efficiencyvaries with filter type, extraction protocol, and PCR inhibition
-
7Sequencing depth and biasPCR amplification introduces taxon-specific biases through primer efficiency differences; mitochondrial copy number also varies substantially between species and tissue types, further distorting the relationship between read counts and organism abundance
Each of these factors introduces variance that is independent of the actual number of organisms in the environment. The cumulative effect is that the relationship between detected read count and actual organism abundance is highly non-linear, varies between taxa, and cannot currently be calibrated without controlled experimental data for each target species in each environment.
2. The honest assessment: not quantitative for absolute counts
Clare et al. (2022) were explicit about this in their original paper and in subsequent commentary. The Scientific American report of their work quoted Clare directly: "Does a larger signal of a species’ DNA indicate the presence of many individuals or just one that happens to be closer to the sampling station? This is one of the hottest topics in eDNA research circles. The simple answer is no. You can’t know the abundance unless you have extremely controlled conditions."
This is a statement of scientific honesty that practitioners and policymakers must take seriously. Airborne eDNA should not be presented to government clients as a tool for estimating population sizes, at least under current methodological standards.
The analogous debate in aquatic eDNA is instructive. After a decade of research, quantitative aquatic eDNA (measured by digital droplet PCR for absolute copy number) has been validated for a narrow set of conditions: primarily wadeable rivers, specific target species, with calibration data from concurrent conventional surveys (Lacoursière-Roussel et al. 2016; Ushio et al. 2018). Even there, the method provides semi-quantitative rather than fully quantitative data.
3. What IS possible: relative abundance and trend detection
The picture is more encouraging when the question shifts from absolute abundance to relative abundance trends over time. This is an important distinction:
Sullivan et al. (2025) provided the most compelling validation to date. They compared eDNA-derived abundance indices for bird genera in their 34-year Swedish archive against independent point-transect survey counts from the Swedish Bird Survey. The correlation was strong and relative abundances from the traditional surveys explained 60% of the variation in eDNA relative abundances.
This is not an estimate of absolute bird numbers, but it is a reliable indicator of directional change, which is precisely what biodiversity trend monitoring (as required under the EU Nature Restoration Law, the CBD Global Biodiversity Framework, and national biodiversity strategies) actually needs.
Jager et al. (2025) found a positive correlation between total species biomass in zoo enclosures and eDNA signal strength for vertebrates, and the result deserves closer attention than a brief mention. Their passive sampler (the Nutshell DNAir sampler, deployed for up to 96 hours) outperformed active samplers in species richness accumulation and showed a positive biomass-signal correlation: enclosures housing larger total animal biomass produced stronger eDNA detections. This finding carries two important implications. First, it suggests that over extended deployment periods, passive samplers may actually be more informative for biomass-based trend estimation than active spot-samplers, because integration time allows them to accumulate signal from the full range of resident animals rather than capturing a stochastic moment. Second, the biomass correlation, if it generalises beyond zoo settings, would provide a pathway to semi-quantitative population monitoring: changes in signal strength across seasons or years could be interpreted as changes in local biomass, even without converting to absolute individual counts. Both implications require validation in open landscape settings before they can be operationalised, but the Jager et al. result is the most direct evidence to date that passive airborne eDNA signal tracks biological quantity, not merely presence.
4. Specific conditions under which quantification is more reliable
Several conditions improve the reliability of quantitative inference from airborne eDNA:
5. The metabarcoding quantification problem
Even setting aside the physical factors, standard metabarcoding approaches introduce quantitative biases through PCR amplification. Because different taxa amplify with different efficiencies under the same PCR conditions (due to primer binding affinity differences), the proportion of reads assigned to each taxon does not directly reflect their relative contribution to the original DNA pool.
This is a field-wide problem in metabarcoding, not unique to airborne eDNA (Alberdi et al. 2018; Bohmann et al. 2022; Ushio et al. 2018). Two distinct sources of bias are now recognised as particularly important: inter-species variation in mitochondrial DNA copy number (which means equal biomass of two species can yield very different starting template concentrations) and differential PCR amplification efficiency driven by primer-template mismatches. Wolany et al. (2026; preprint) have attempted to formally disentangle these two effects and propose correction methods applicable to standard metabarcoding pipelines, though independent validation is needed. Several other approaches have been proposed to reduce amplification bias: balanced primer design, careful sample labelling and library preparation (Bohmann et al. 2022), internal standard addition (spike-ins), and digital droplet PCR for specific targets. For multi-taxon community monitoring, these corrections are difficult to apply universally.
Shotgun sequencing (as used by Sullivan et al. 2025) avoids PCR-related bias by not using target-specific primers, producing a more proportional representation of the DNA pool. However, the interpretation still requires accounting for genome size differences between taxa (a large mammal genome produces more reads than a small bacterial genome from equivalent numbers of cells) and copy number differences.
6. Semi-quantitative frameworks: the practical middle ground
Given these limitations, the most defensible position for current practice is a semi-quantitative framework that:
-
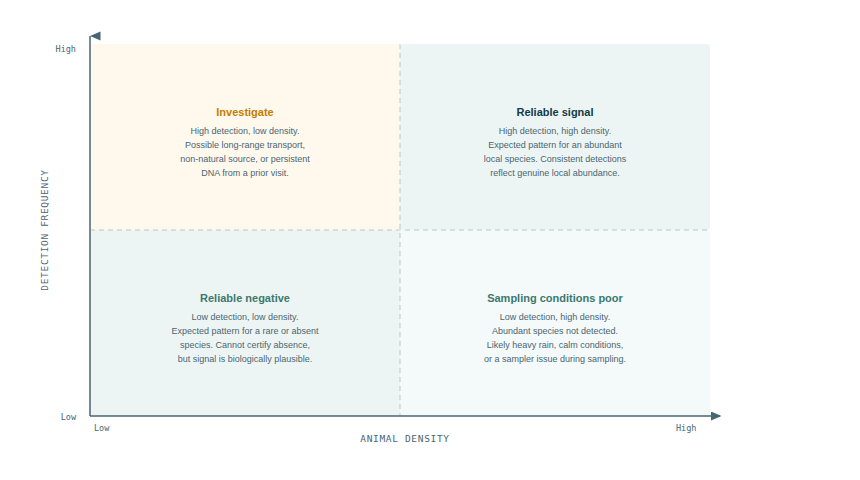
1Uses presence/absence as the primary detection outcome
-
2Uses detection consistency across multiple samples as a proxy for local abundance (more detections = more likely locally abundant)
-
3Uses within-sample read proportions as indicative of relative (not absolute) community composition
-
4Tracks changes in eDNA signal over time as an indicator of population trends rather than absolute counts
-
5Calibrates against independent abundance data where available, using statistical occupancy models
This framework is more conservative than claiming quantitative capability, but it is scientifically defensible and provides information that is genuinely useful for biodiversity trend monitoring.
7. Caveats and open questions
The field needs controlled calibration experiments. To understand the relationship between animal density and airborne DNA concentration, controlled experiments with known numbers of animals in defined spaces are required. Very few such experiments exist for airborne eDNA.
Cross-taxon quantification remains intractable without major methodological advances. Even if within-taxon trends can be tracked, comparing abundance across taxa (e.g. comparing insect biomass with mammal DNA signal) requires knowing species-specific shedding rates and particle physics properties: information that largely does not exist.
Reference databases affect apparent abundance. Taxa with more complete reference sequences will have more reads assigned and appear more abundant than equally present taxa with sparse reference coverage. This creates systematic biases that are difficult to correct.
References
- Clare EL et al. (2022). Measuring biodiversity from DNA in the air. Current Biology 32:693–700. https://doi.org/10.1016/j.cub.2021.11.064
- Sullivan AR et al. (2025). Airborne eDNA captures three decades of ecosystem biodiversity. Nature Communications 16:11281. https://doi.org/10.1038/s41467-025-67676-7
- Lacoursière-Roussel A et al. (2016). Quantifying relative fish abundance with eDNA: a promising tool for fisheries management. Journal of Applied Ecology 53:1148–1157. https://doi.org/10.1111/1365-2664.12598
- Ushio M et al. (2018). Quantitative monitoring of multispecies fish environmental DNA using high-throughput sequencing. Metabarcoding and Metagenomics 2:e23297. https://doi.org/10.3897/mbmg.2.23297
- Jager H et al. (2025). A breath of fresh air: comparative evaluation of passive versus active airborne eDNA sampling strategies. bioRxiv. https://doi.org/10.1101/2025.03.26.645491
- Klepke MJ et al. (2022). Accumulation and diversity of airborne, eukaryotic environmental DNA. Environmental DNA 4:1323–1339. https://doi.org/10.1002/edn3.340
- Cristescu ME & Hebert PDN (2018). Uses and misuses of environmental DNA in biodiversity science and conservation. Annual Review of Ecology, Evolution and Systematics 49:209–230. https://doi.org/10.1146/annurev-ecolsys-110617-062558
- Alberdi A et al. (2018). Scrutinizing key steps for reliable metabarcoding of environmental samples. Methods in Ecology and Evolution 9:134–147. https://doi.org/10.1111/2041-210x.12849
- Bohmann K et al. (2022). Strategies for sample labelling and library preparation in DNA metabarcoding studies. Molecular Ecology Resources 22:1231–1246. https://doi.org/10.1111/1755-0998.13512
- Wolany L et al. (2026). Disentangling mitochondrial copy number variation and PCR amplification bias in DNA metabarcoding. bioRxiv (preprint). https://doi.org/10.64898/2026.04.07.716896